Financial blogger Logan Mohtashami is not the first and certainly won’t be the last to write about whether the U.S. is entering another housing bubble.
With more than 30 years of experience in the home lending business, he recently remarked “it is bullish for housing that year-over-year real home prices went negative last year” as shown on the three Case-Shiller indexes below.
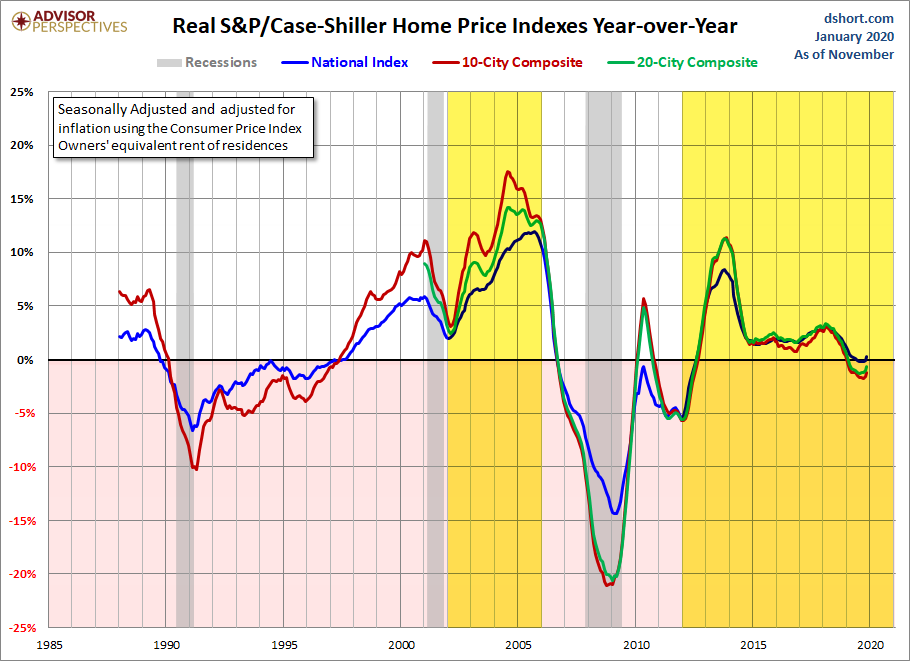
“Despite what some want you to believe, this housing cycle is not in a bubble. Look at the difference in the metrics for the real bubble years of 2002-2005 compared to the current cycle years 2012-2020.” – Logan Mohtashami | HousingWire
Did the Valley mirror this cycle? See the Cromford Market Index graph shared by senior analyst Tina Tamboer at the Scottsdale REALTORS® Influencer Marketing panel.*
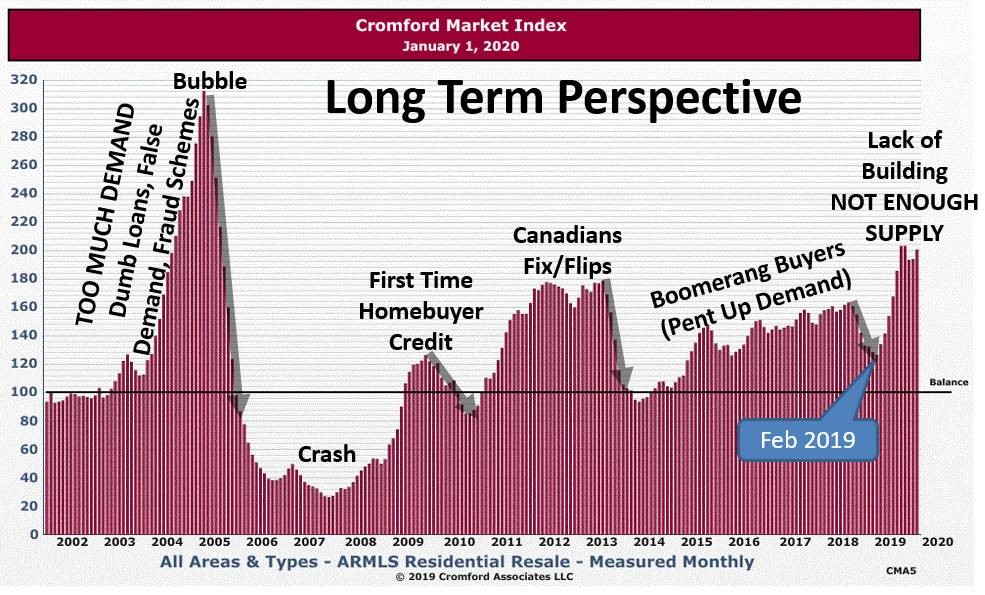
“What pushed demand so high?,” Tamboer asked the sellout crowd. “Dumb loans and false demand — somebody buying the house who’s not going to live in it and not going to rent it. Now, we’re back to normal demand, but we have no houses for them to buy.”
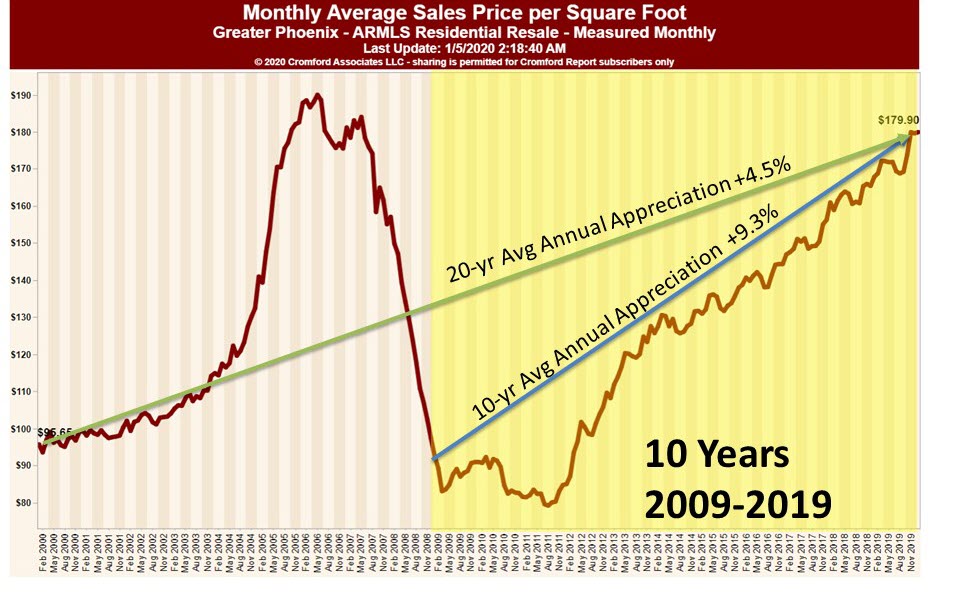
Despite the market rollercoaster, Tamboer said homeowners who kept their homes through the Bubble and the Crash saw a 20-year average Annual Appreciation Rate of 4.5%. Between 2009 and 2019, that rate more than doubled to 9.3% as shown below.
In a future blog post, Tamboer explains the importance of how rising home prices are relative to interest rates by comparing Average Prices and Monthly Payments.
*The next Influencer Marketing panel is Feb. 21, 2020. Sign up for notifications.